DX Lab Fellows Diary
Post by Elisa Lee and Adam Hinshaw DX Lab Fellows
Mon 8 February – Project Kick-off and Curatorial and Librarian Workshop with Digital Experience Division, Library & Information Services, Exhibitions, Research & Discovery, Information & Access and Digitisation & Imaging.
Today we officially started the project and were welcomed by the Digital Experience Division, the State Librarian and Chief Executive and the Mitchell Librarian and Director, Education & Scholarship. This was followed by a presentation and “curatorial and librarian” workshop. Fantastic to get the ball rolling and meet more State Library Staff who have all been extremely interesting, insightful and helpful.
Insights:
- Audio and video will not be accessible online before the end of the financial year.
- In 2013/2014 there were 41 million searches / year.
- Not all physical requests go through a digital process as it can be done through a paper Stack Request Slip. We could capture this data when people access the item via the catalogue – before filling out the request slip.
- Staff and Public – Cataloguers search in the backend. R&D staff research for the public via the front end. Best to exclude cataloguers searching as it is not representative of the public.
- Explore how to visually represent items without images through a cover generator using elements such as dewey decimal colour coding, typography, and images. 90% of the collection has no image. References: Chris Gaul’s work at the UTS Library on DD colour coding and NYPL Labs Generative e-Book Covers.
Information the curators would like to see:
- Format of the item e.g. photo / film / audio etc. note: album is not a format.
- Dewey decimal code
- Date of creation
- Option to filter by Children and Young Adults to skew results to this audience.
- How do people find stuff? i.e. Catalogue searching or referrals e.g. views which come from a direct link from Flickr, Wikipedia, Twitter, Pinterest etc. Note: this information is already available through Google Analytics.
- Some way to save, like or comment on an item in the visualisation to then be able to access.
Tue 9 Feb – Technical Workshop
Timings:
- Adlib (ACMS Replacement) and Rosetta (DAM Replacement) to go live (non-published material – manuscripts and pictures). Live feed for our purposes developed sometime after that.
- Primo (New discovery layer) and Alma (Millennium replacement) to go live (published material – catalogue). Also E-Resources. Live feed for our purposes developed sometime after that.
- Potentially include Odilo feed (subset of E-Books targeted at independent publishers).
Insights:
- Albums will no longer have one hero thumbnail. Their entry will contain thumbnails of all items in the album. So, which image do we choose to represent the album? Decision: try with the first image. If this image is shown to be not so interesting (e.g. a lot are quite generic covers), then we could look at a random selector algorithm.
- Cataloguers searching in the backend. SL could eliminate this activity from the feed by detecting the ISBN.
- Storing of data done library side.

Wed 10 February – Google Analytics meeting, Stacks Tour with Curators
Investigation of what we might be able to pull out from Google Analytics or weblogs to have a sample set of data to see quantity and rhythms of activity and what type of content is being accessed in lieu of receiving a real data feed post deployment of Adlib and Rosetta.
Insights:
- One of the most popular items (viewed 871 in one month?) was an HSC student assignment in pdf format. This has no graphic asset attached to it beside a pdf icon. Definitely requires some graphic / typographic treatment.
- Staff have so much knowledge and many stories to share. How wonderful if that knowledge could be added to the catalogue information.
Stacks tour: Mind blowing! Thought of it as a physical representation of the internet. So many interesting objects with incredible histories attached. Could spend years down here.
Wed 24 February – Presentation to Digital Experience Division and Media and Communications.
Insights:
- 11-808, a project created during our UTS Library Artist-in-Residence is a playful visualisation of the movements of books and objects requested and returned from the Library Retrieval System. The UTS Librarians used the system to create poetry by requesting items in a sequence which were then replayed through the visualisation. As a follow on from this, a wonderful idea emerged from this meeting – A live curator’s view. A twitter post could be sent out advising that a curator would be exploring content live which would then be reflected in the live feed. Another idea was that the curator feed could be a separate mode but there was interest in having it mixed up with other audience activity.
- Opportunity to set up user testing throughout project.
- Everyone is very interested in analytics but this is most likely a separate project. GA should provide most of that information which could be visualised in a meaningful form and disseminated to the right people.
- Discussion of stand-alone version and “Record a session” functionality.
- Interest in learning about how we re-purpose code for different outcomes e.g. web version, installation version.
- Physical / tangible side, links in with onsite opportunities
- From our discussions up until this point it is clear that the project is no longer Search and Discover as this doesn’t include traffic coming from direct referrals. It is more like Reveal.
Wed 10 March – Web logs
The GA team has provided a script to export web logs so we can see a sample set of data. We are looking forward to investigating activity and rhythms with sample content.
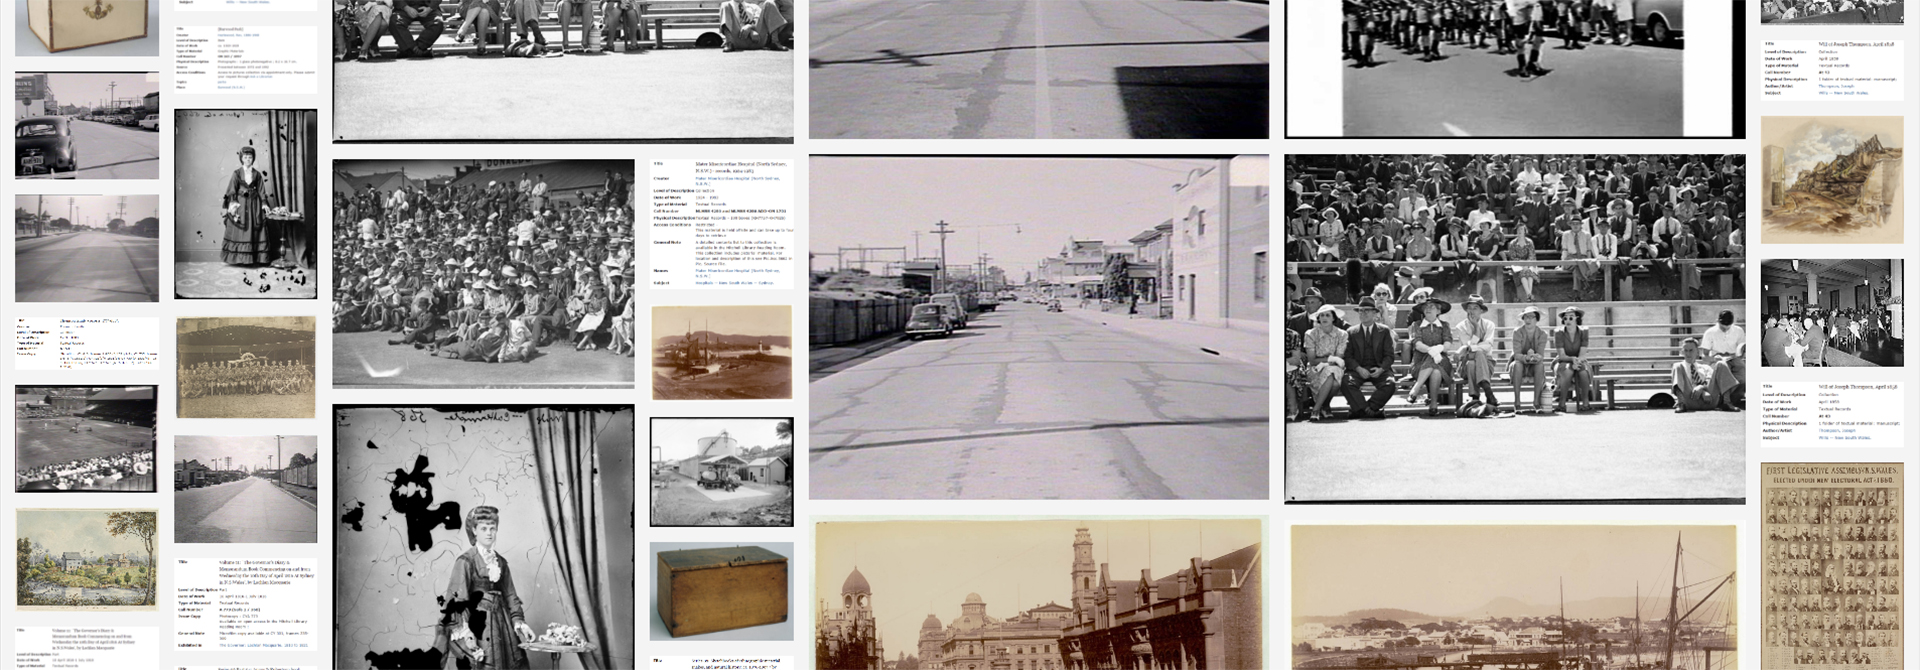
Here is the first sample of real content taken from the weblogs. On January 18th, 2016 between 12:00 -12:20pm there were 49 items viewed from Manuscripts and Pictures (non-published). Somebody is searching for images on tennis, likely inspired by the Australian Open running at this time, many images from the Holtermann Collection and two boxes. About 25% of views don’t have images attached.

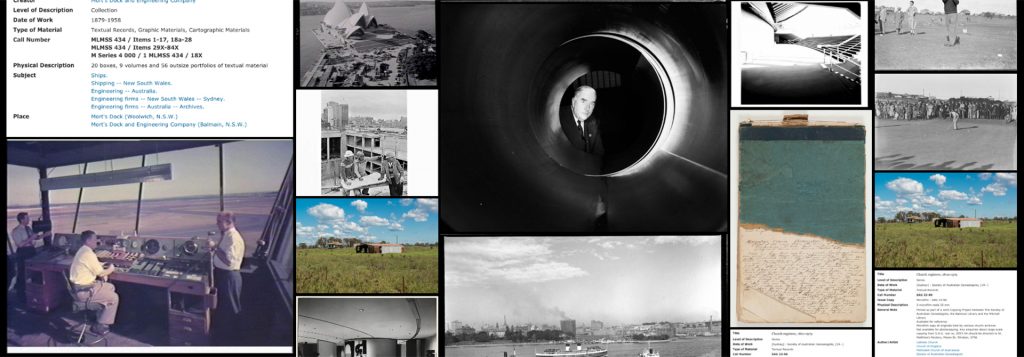
Same time-frame but one day later. There are an equal number of views but this time we have some colour, which contrasts well with stunning black and white photos by Max Dupain.

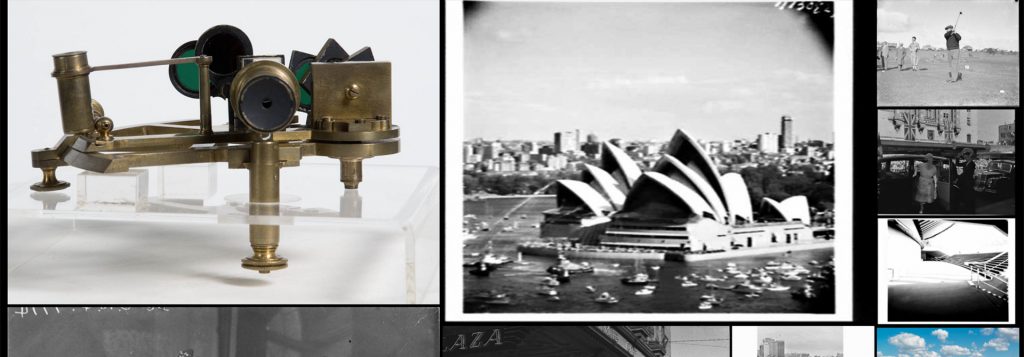
There is a beautiful interrelationship of form between these two images above, both were viewed at 12:00pm. It’d be interesting to have a news feed running alongside the visualisation so we can see if there is any correlation between views and current events. We are also considering a timeline plotting activity over the course of a day to visualise peaks and troughs. The next stage is to look at the grid, typography for labels and how we will treat entries without image assets.

