Loom: API experiment
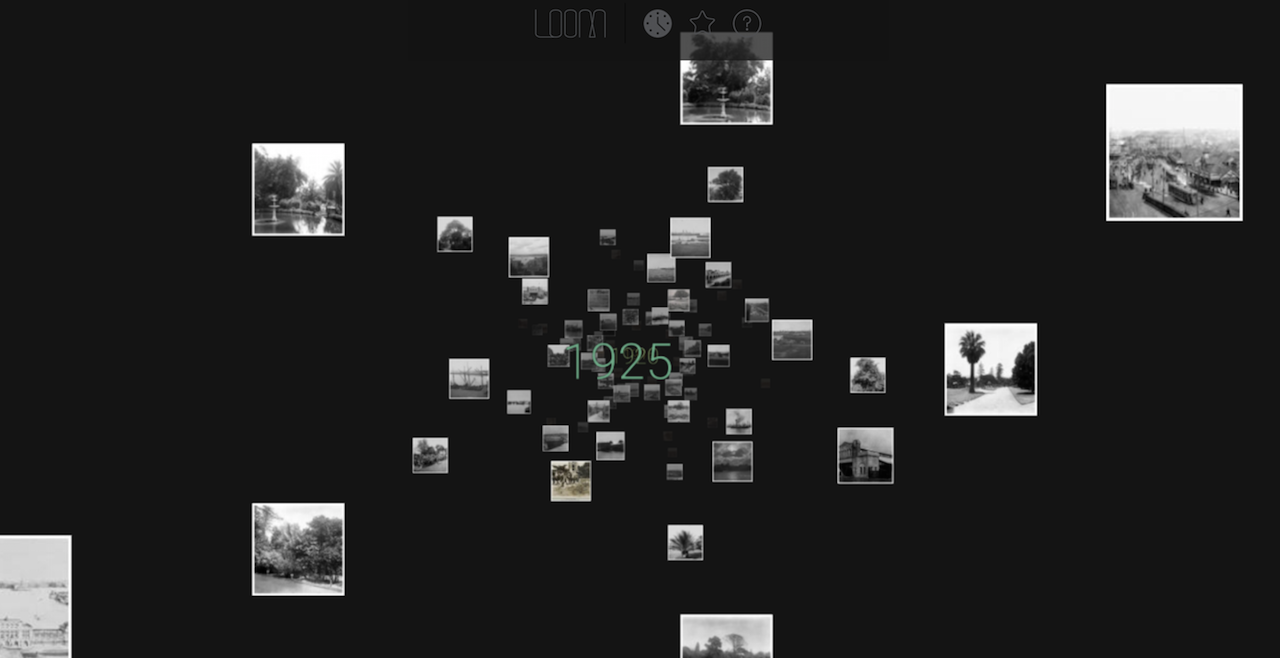
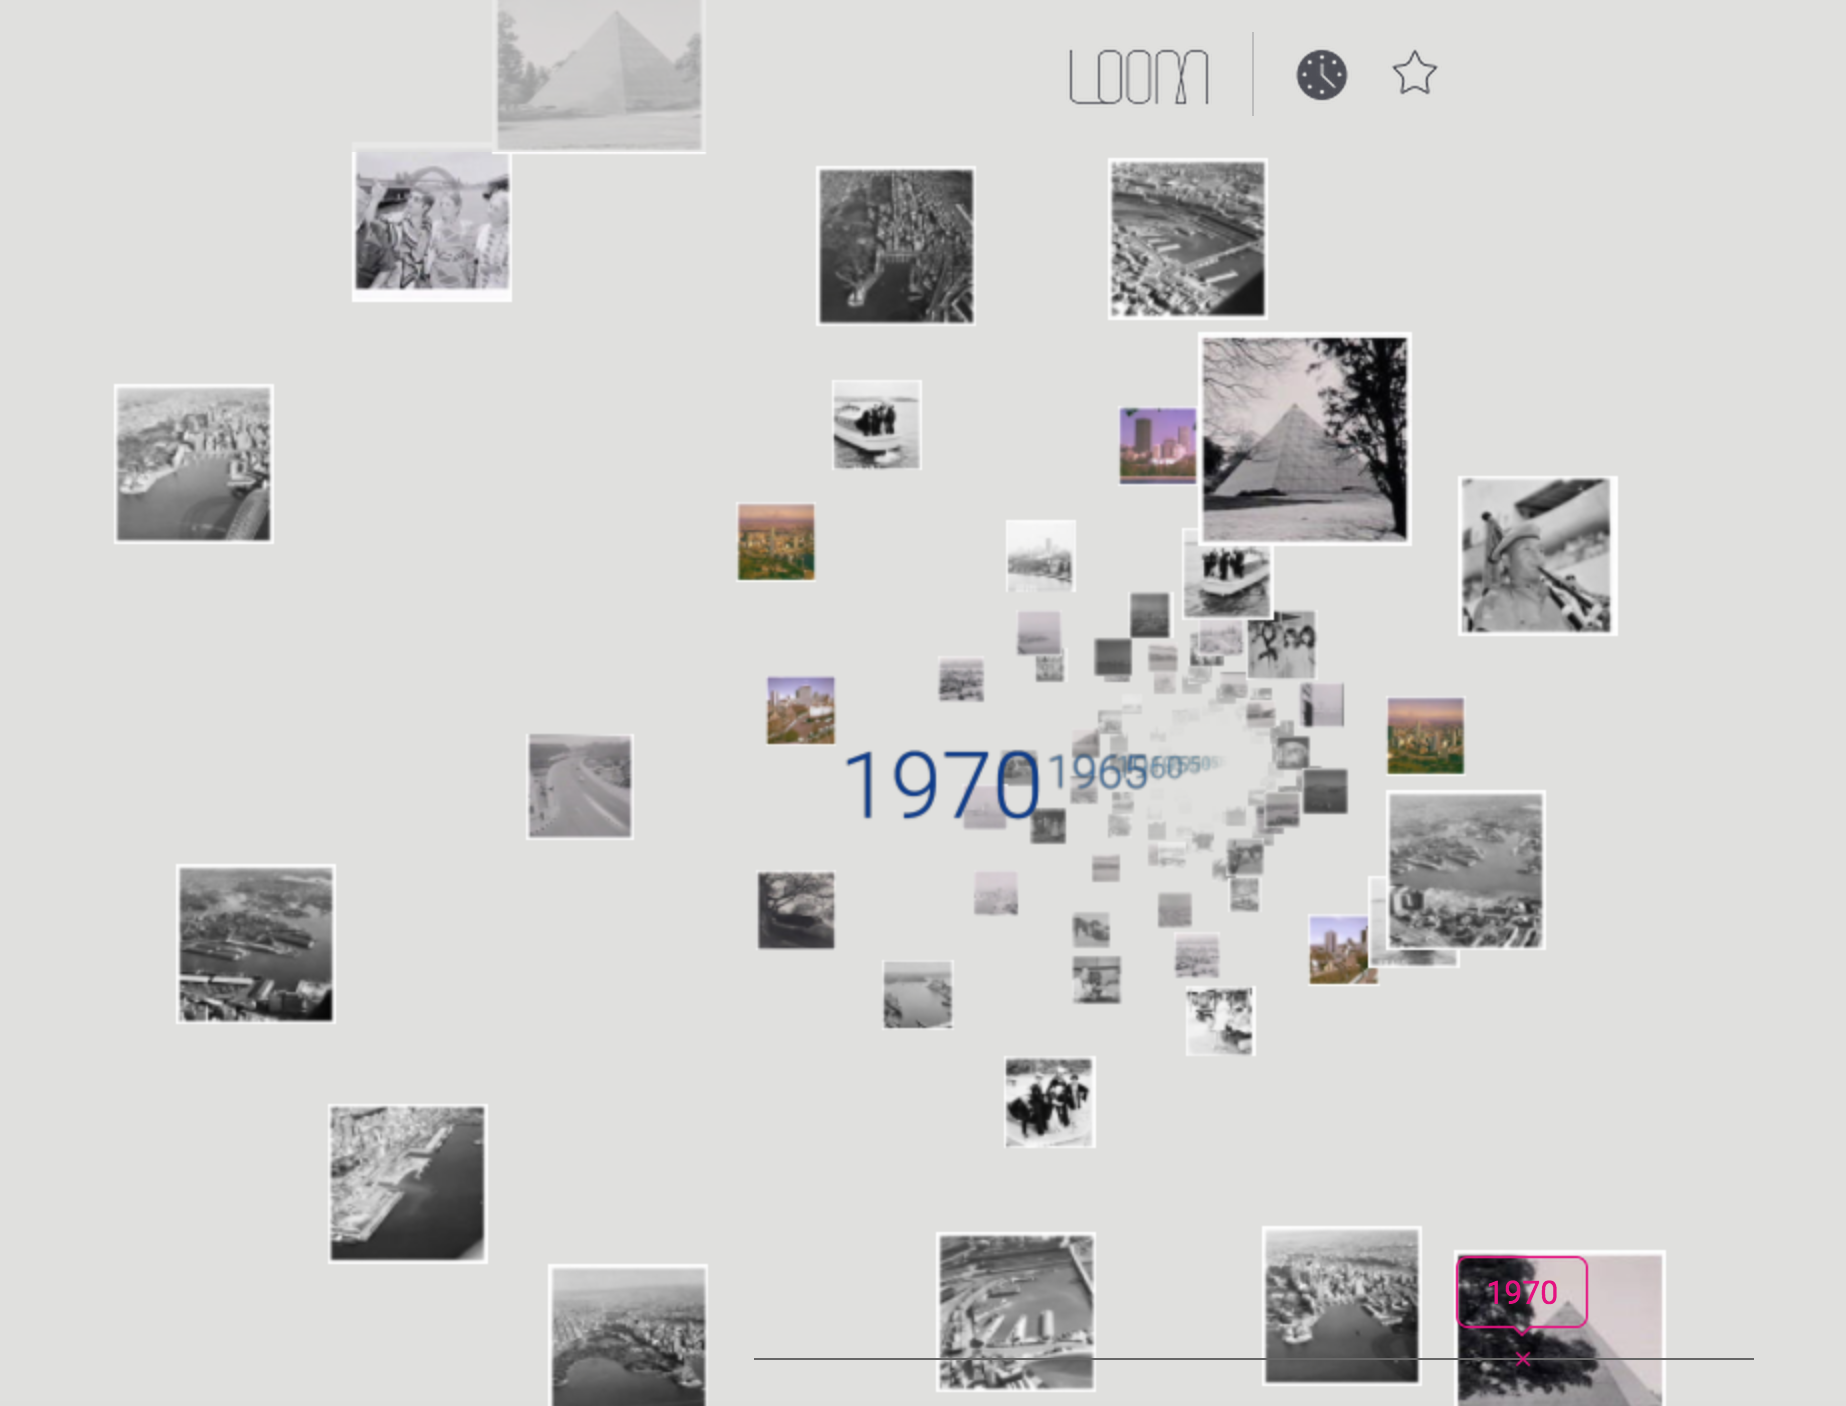
LOOM is the first experiment for the DX Lab and it’s a new way to experience some of the data from our collections. This is the beginning of phase one, the galaxy view, and it is using collection items located at Circular Quay, Darling Harbour and the Botanic Gardens. In this first phase you can fly through decades from the years 1870 to 2000. At the moment this experience is optimised for desktop.
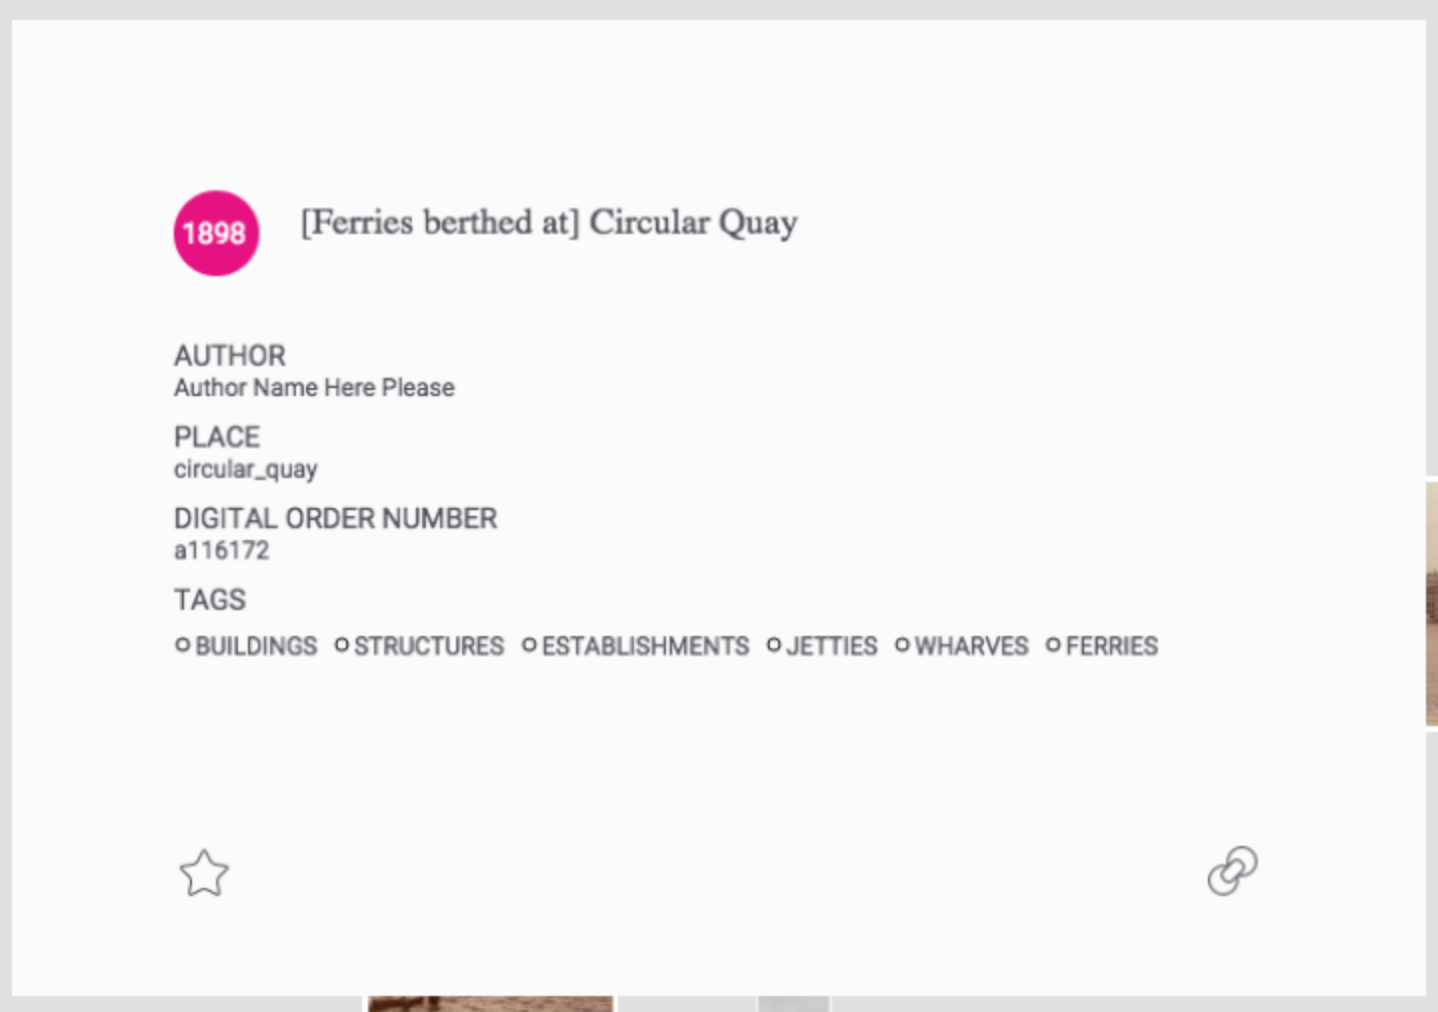
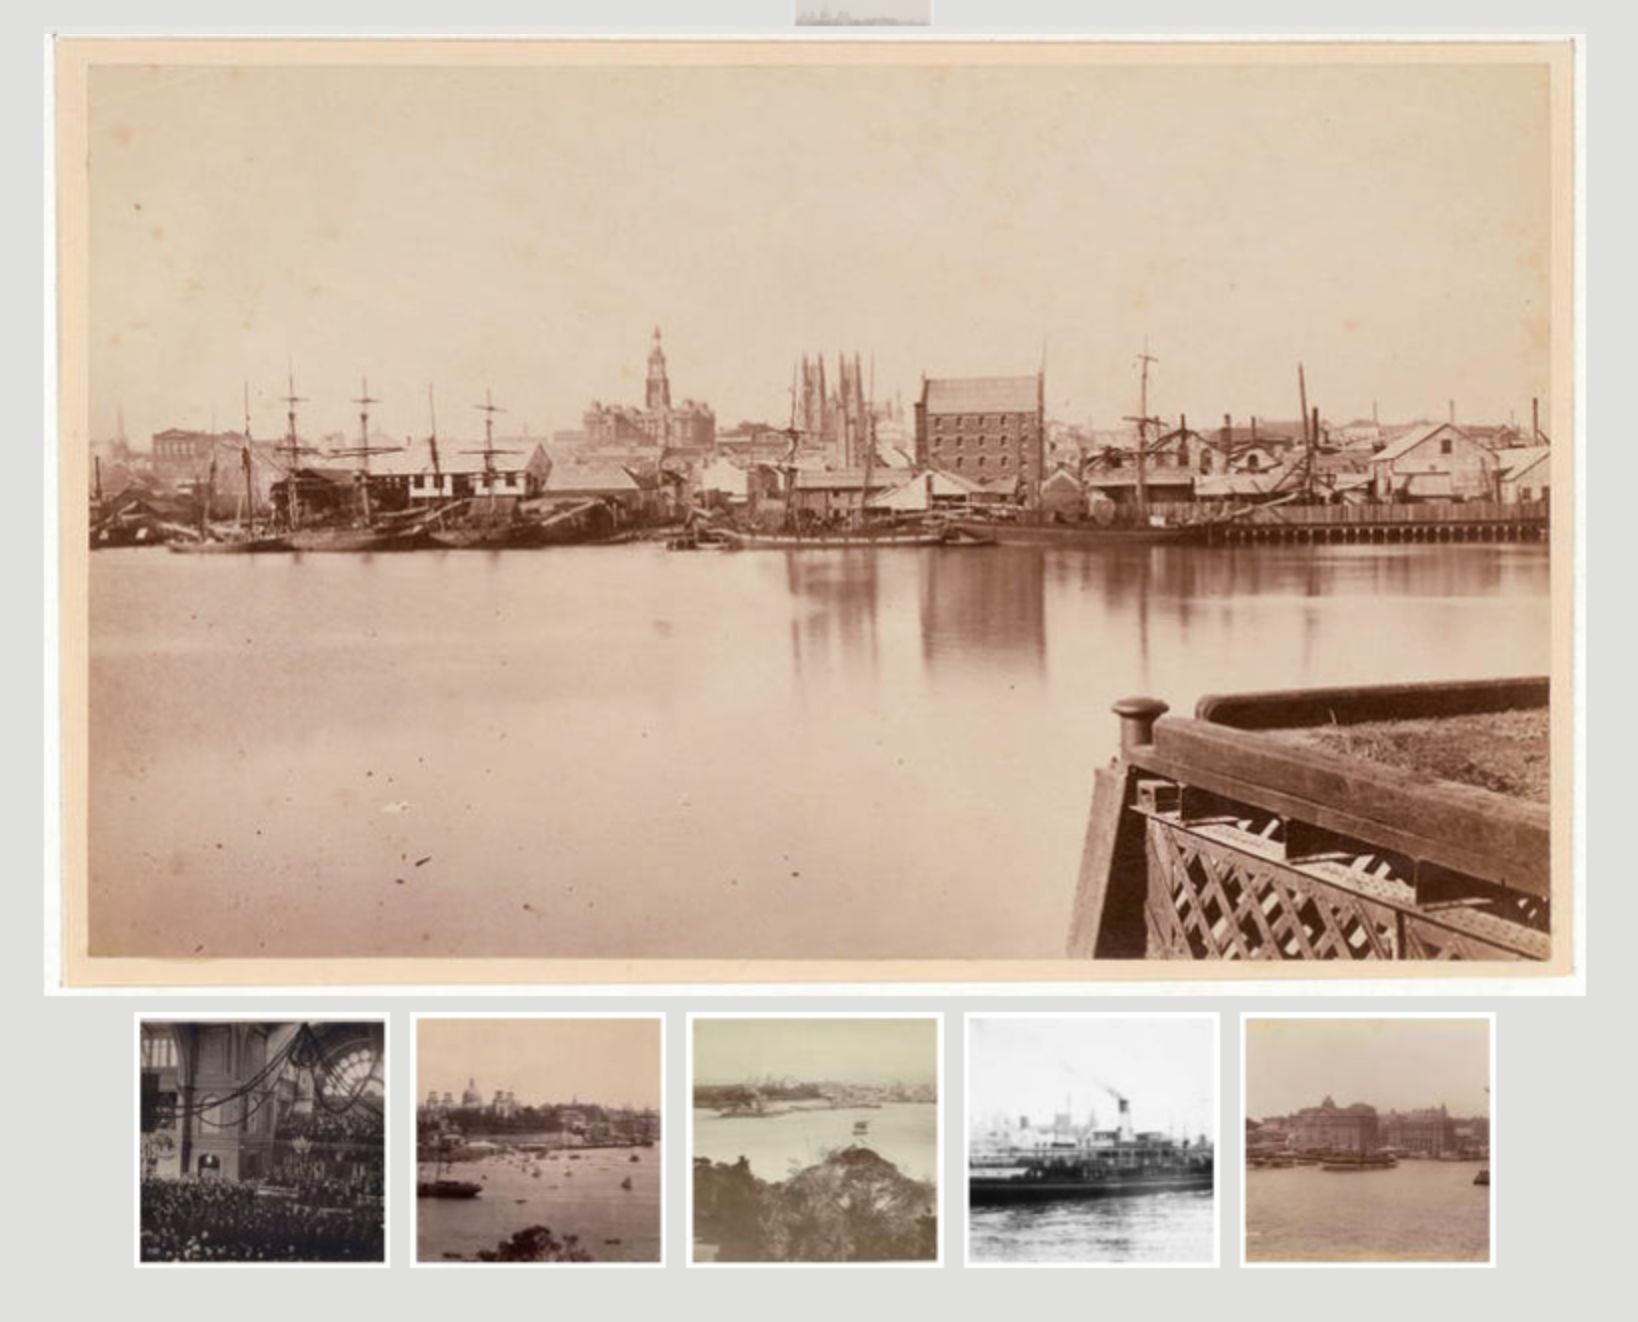
Each decade has five images per location that you can explore, tap the image to reveal the ‘library card’ with the data from our catalogue record, favourite it and hit the link that takes you to the catalogue record if you need the full details about each image. You can also see similar images to the one you have selected below the image. Similar images are being pulled in from the tags.
Exploring through the tag related images is a good way to experience LOOM. If you favourite (star) images along the way then hit the star icon at the top when you are finished, this reveals all your saved favourites. LOOM is a work in progress and we are aiming to build two additional viewing experiences with more features and more data.
LOOM is a big data collaboration with creative agency Grumpy Sailor.
Our aims for this visualisation have included:
- To showcase the Library’s collection in a new and engaging way
- Highlight how data can be connected in a visually beautiful but also in a meaningful way
- Use our API, we need to build with this and learn about it to inform others
- To promote the DX Lab values and design principles
- Is the ‘thing about the thing’, it can leave room for others to improve and build upon (doesn’t necessarily have to be complete or finished)
- Be openly licensed for re-use.
- To share the making of this visualisation and the things we found
Maggie Patton, Manager Research and Discovery describes why the three locations were selected for LOOM.
The State Library has a rich collection of artworks, drawings, photographs and maps documenting the development of Sydney from early settlement to an international destination in the 21st century. For our first implementation of LOOM we chose images around Darling Harbour, Circular Quay, and the Royal Botanic Gardens. Since 1788 these locations have reflected the constant change and evolution of the city.
In the nineteenth century the area around Darling Harbour and Cockle Bay became the economic hub of Sydney with wharves, goods yards, wool stores and factories contributing to the city’s economy. The Quay has witnessed the arrival of thousands of settlers, migrants and visitors and is now a central transport hub and entertainment precinct with international recognition. The Botanic Gardens, established in 1816, is the oldest botanic garden in Australia, a green space for leisure and celebration for almost 200 years.
Below is a Q&A with Grumpy Sailor about building this experience using the Library’s data.
We gave you a fairly open brief to experiment with the Library’s API and collections, what were some of the initial challenges that you came across with the API?
When briefed to do something innovative and experimental with the State Libraries data sets we never could have imagined the depth to the archive. Not until we started weaving our way through the collections, guided by the curators did we realise how expansive it was. The further we explored, the more interesting the angles we discovered. Data can tell us all sorts of stories, if you let yourself be guided by it. We spent a good deal of time in the creative development stage, nodding and saying “Hmmm that’s interesting”.
Our team must have spent a week in the grips of the archive vortex. We became engrossed in following stories and taking ourselves on a journey through some incredible images, artworks and maps. Every idea thrown up sparked interest and excitement. The challenge was to stay focused on our objective “Locally contextualised information, showing me how to use it, whilst inspiring possibility” . Our ideas also needed to be realistic and achievable to be showcased at Remix in 4 weeks time. Another challenge was in understanding how we could use the data behind the archives. Reviewing the metadata did uncover quite a few challenges as it was not simply choosing a search query to spit out data to use. There was a lot of manual work involved in ensuring the best and most accurate images were selected.
What is Loom built in and what were some of the technical challenges?
LOOM was built in a WebGL environment using CSS, javascript and HTML. WebGL allows you to do many wonderful things, particularly because you can render 3D graphics in real time. We had several technical challenges in this project, the first we had to overcome was the use of high resolution imagery in an environment that was already using a great deal of processing power. This was further compounded by using text and imagery in the same build. Workarounds were required for the text display, which was tough to negotiate in short timeframes. Which brings us to the next rather large technical issue. Building to a strict deadline can be tough, and though it forces you to prioritise and make decisions quickly it can sometimes leave those solutions that take a little longer off the table in favour of a quick fix.
At Grumpy Sailor we believe in and champion a rapid prototyping methodology. This sometimes makes the push and pull between polish and deadline a tough one to navigate, specifically as you sail into the final throws of delivery. The third and final big technical issue was how we dealt with the data itself. One thing you really want when dealing with large datasets is a consistency in values. Which is hard with a libraries dataset, digitising on mass, over a long time. The creative parameters of this first stage of the visualisation were affected more by the limitations of the metadata than the actual brief. That said, parameters are a vital part of the creative process and help to create a solution unlike any other. Which is how we arrived at Loom.
Do you think Loom will be more for the serendipitous exploration of our collections or could it lead onto being a great tool for research?
The real beauty of LOOM is that it does serve well as both a serendipitous exploration and an avenue for people to explore the archives in more depth. Our intention was to create an environment that moves away from the “search box” and gives users a new way in. Once in, they can choose to roam freely, sparking ideas and interest as they go, leading them back to the libraries main online search tool (ACMS) to further their research. It’s really about saying to the user “it’s OK to come into the archive not knowing what you’re looking for” but also -this will become apparent in the other lenses of Loom –
“if you have an inkling of what you are trying to find you can use this search application as a crowbar into the collection”.
Several testers have also mentioned that this kind of navigation could be applied to a number of different collections. A new way to view specific topic, a personal album or even a larger chunk of the collection. What’s really exciting is that we are only at the beginning of understanding what this tool can actually do.
We are aiming to build two more viewing experiences for Loom, can you tell us a bit about these and how they can be used with this first phase.
LOOM was born as a multi layered visualisation. A new way of exploring the collection. For launch at Remix we developed the first stage of the visualisation, which is to view the data by ‘time’ or what we endearingly refer to as ‘looseleaf.’ To really enjoy and understand the power of the Loom experiment, users will be able to navigate that same data through two other viewing experiences, or lenses if you will. In collaboration with the incredible team at the State Library we will be developing another two lenses one being ‘place’ or what we are calling the ‘atlas’ – at the other an ‘abstraction’ of the data called ‘index’.
‘Atlas’ contextualises the data by placing it geographically on a map of the city and displays the number of data responses as elevation. ‘Index’ will be using that same data, but taking a more conceptual or abstract approach. It could, for example, involve colour analysis, sentiment analysis or other processing to represent the same data through a more artistic lens. ‘Index’ at it’s heart is about looking at the meta data behind the collection.
What we are aiming to achieve with the three viewing experiences is to allow the user to jump easily between three lenses, contextualising the information in different ways. This will hopefully create a sense of intrigue and curiosity for the user and allow them to very simply and intuitively navigate through a sample of the State Library’s collection.
Check out LOOM here, we hope you enjoy this experiment.
Comments
Amazing project!
it’s a pity is not yet available for mobile.
I take this opportunity to congratulate for your works at DX Lab, I really appreciate the project.
If you need a software developer (web/mobile) let me know! :)
Ciao
I have tried your Loom program, and although a new perhaps unusual way to view images rapidly. It is a bit of challenge to use, and is in need of more refinement. To make it more user friendly. To me it feels just to loose/fluid, and at times it is therefore hard to navigate.
By the way I noticed the location, as described on the back of a couple of images, was not correct.
Unfortunately I could not access Loom on Internet Explorer 10. The page is perpetually “loading assets”. The page does not seem to be blocked by any workplace network constraints.
The idea of the project looks great – let me know if there is anything I can do to improve access.
Hi Justin
Thanks for visiting our site. I hope you will try Loom again – using another browser. At this stage, Loom is optimised for desktop, and works well on the latest versions of Safari, Chrome, Firefox and IE for both Mac and PC. It is built using WebGL.
-Ruth