80Hz: Part 1. Research
The next few blog posts, written by Thomas Wing-Evans, will focus on the research and production of the architectural sound experience 80Hz Sound Lab. This project has been a collaboration with the DX Lab and is the result of the DX Lab Fellowship awarded to Thomas earlier this year. This research is supported through a gift to the State Library of NSW Foundation.
Proposal
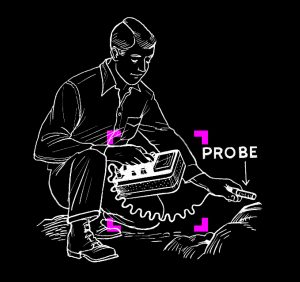
Humans have been using sound as a communication tool for millennia. Sound embodies information – warnings, welcomes, friends and foes are all wrapped up in noise. At some point, someone had the bright idea of fashioning tools to create and control it. One of the earliest of these – a piece of wood whittled into an oval, attached to a cord, whirled in a circle overhead – produced a powerful hum that pulsated with a frequency around 80Hz. The sound could be heard for miles, allowing communication across vast plains. Think of it like a palaeolithic text message. In this way sound became a universal language.
Over time we built societies and cities and sound transformed. Information became abundant and definitions of sound multiplied – emotion, music, acoustic, electric, wave, vibration and speed. New tools were created to interpret new information – clock ticks time, stethoscope beats life, waka waka goes Pac-Man. We have gone from sending simple messages to constructing networks of exponentially created data (fifty thousand gigabytes a second, or about 50 million cat photos if you were wondering). Hearing data, not just seeing it, could be the key to a more nuanced understanding of our world.
The State Library of NSW has an ambitious digitisation program to create and preserve approximately 20 million collection images and pages during the next decade. The challenge is how to maintain the compelling nature of the collection once digitised, and how to enhance the visceral connection that people already have with it.
It was for this reason that I proposed to use sound as a means to explore the Library’s image collection. By translating data into sound values, paintings could feasibly be transformed into rhythm, melody, pitch and so on. Bonkers, I know. Using sonification, the data could become experiential and temporal. Like reading a novel, details would emerge from the image over time. Since music is inherently emotive, the soundscape of an image might remain with someone longer than if they had simply glanced at it. In a nutshell, introducing sound adds another layer of exploration.
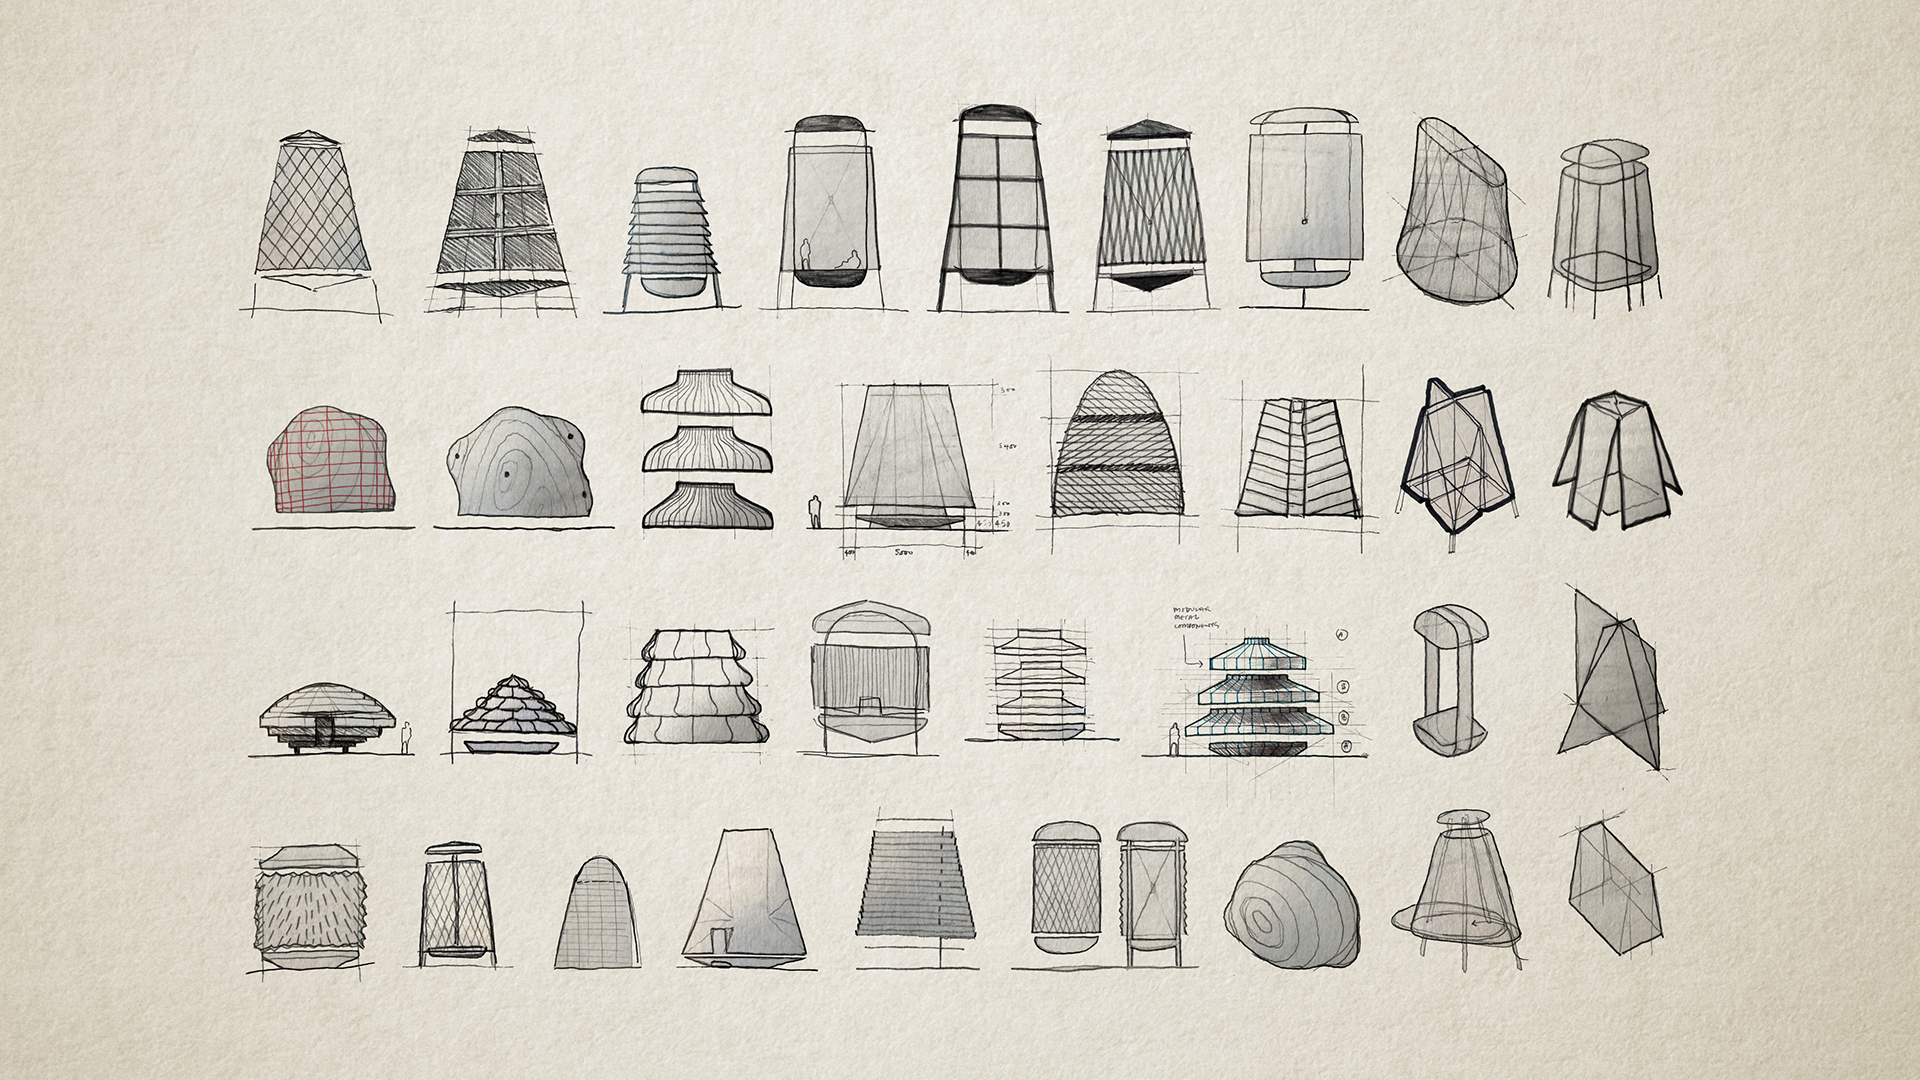
Digitisation is a brilliant method of preserving a moment in time, whilst also providing new ways to link different artefacts through data. Paintings no longer exist in isolation, but become networked through metadata. Previously, placing the brush down meant an art piece was finished. Now, in digital form they are able to be reinterpreted, translated and remixed as open-ended artworks. Rather ironically though, digitisation has freed them from behind glass and timber frames only to confine them once again to computer screens. Our future cities will be neither physical or digital, but a mixture of both. Looking toward that future, I proposed to pull the data out of the screen and create a hybrid experience – a digital instrument in the city that could be inhabited physically and played manually.
Process
So, how did I plan on doing this? Well, rather unsurprisingly, nothing is completely original. There is in fact already a long and storied history of eccentrics trying to connect the visual (generally colour) and the musical – Australia’s Roy de Maistre even dabbled in chromatic music experiments with his ‘colour orchestrations’ exhibition.
Over the centuries numerous whimsical contraptions have been created in an effort to pair sound and sight, like Leonard Taylor’s keyboard and Alexander Scriabin’s 1915 Clavier à Lumières, which aimed to represent synaesthesia through music and light. Researching these past experiments was both a lesson in what to do and what not to. Firstly, the data that I was using was more complex than colour alone and would require more than one method of extraction. Secondly, the data was interesting enough by itself without the added complexity of linking it to emotion. Music is inherently emotive, so having the restraint to let the data speak for itself would be vital. Humans have a tendency to seek pattern and attribute meaning, so it would be interesting to see what narratives and ideas might develop around an objective music generation framework.
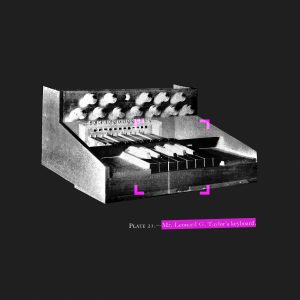
Image Processing
A big question was whether the audio should be generative (live) or pre-rendered, which would define the appropriate methods for image processing and sound generation. I explored a number of different avenues (with invaluable guidance and help from friends Kito and Martha), ranging from Python and ChucK to OpenCV and Sonic Pi. Each was tailored to a different output, which was helpful in testing assumptions. Ultimately I landed on Max/MSP, a visual programming language for the purposes of working with audio, which could handle both live generation and pre-composed audio. This flexibility would be vital as the physical experience and interaction design developed. To deliver the best experience both physically and sonically, Julian Wessels of Sonar Sound took on the development of the Max/MSP component and I would supply him with the painting analysis dataset.
A shortlist of 44 paintings were chosen from the Paintings from the Collection exhibition based on specific criteria – famous locations, prominent artists, historic scenes, or simply whether the image was striking, vivid or visually distinct.
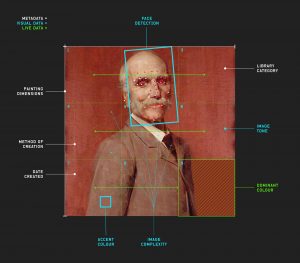
To retrieve the visual data from the images, I used a variety of methods. To determine the proportion of colours in the images, I played around with Laurent Jégou’s analysis and synthetic representation experiment. Parameters were adjusted to affect the outcome which was key in being able to achieve usable results across all images. By reducing the threshold of colour difference for example, the detection of distinct colours became more granular. This helped to draw colour information out of simpler images which might only be comprised of one or two colours, while increasing the fidelity of more visually complex paintings. The results of this process formed the basis for determining a range of complexity values across the images. A byproduct of this process was the ability to return the most dominant colour as a percentage of the total colour range, which enabled a sliding scale of dominance as a method of controlling audio, rather than a binary value. I could have used this tool to define dominant colours for all images, but I explored a number of tools and eventually landed on Microsoft’s Computer Vision API, which had the advantage of returning an accent colour for an image. A handful of the paintings in my selection featured muted tones of brown and black, so being able to pick out accents within the visual content enabled a more nuanced output. The Computer Vision API was able to detect faces, which also fed into the dataset for each image.
Using the image colour summariser API developed by Martin Krzywinski, I was able to determine the ‘intensity’ or average lightness of each image. Given that the paintings had been digitised, it was key to utilise a colour space that preserved the visual information. I was most interested in obtaining the channel statistics for the CIE L*a*b* colour space, as this was designed to be perceptually uniform with respect to human colour vision, device independent and absolute. For this process the average L* value was most relevant, which represents darkest black at 0 and brightest white at 100.
With regard to metadata, it was generally a case of listing datasets like date and category in a spreadsheet for Julian to feed into the Max patch. Some values like ‘location’ (defined by proximity to the library) required minor calculation. To do this I took the approximate location of each painting (often included in the title or from visual cues in the image) and used the Google Maps JavaScript API V3 to compute the distance between the LatLng coordinates of the painting and library. If the location was unclear then the field was left blank, which became another datapoint in itself to define the audio.
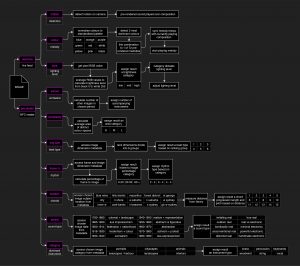
The process of turning these abstract data points into music was the next challenge. I provided Sonar with an initial composition flow chart, which outlined my thinking on how the data values could be translated into musical components.
Next up: Read an interview with Julian Wessels from Sonar in part 2.
80Hz: Sound Lab closed 26 November.
Research Appendix
Goethe’s Colour Theory, Rupprecht Matthaei 1971
Visual Art Through Composition : Talks on Basic Principles of Art, Václav Mácha 1974
Visual music : Synaesthesia in Art and Music Since 1900, Kerry Brougher 2005
Universal Usability : Designing Computer Interfaces for Diverse User Populations, Jonathan Lazar 2007
Brand Atlas : Branding Intelligence Made Visible, Alina Wheeler 2011
Colour : A Handbook of the Theory of Colour, George H. Hurst 1900
Image Processing, Analysis, and Machine Vision, Milan Sonka, Vaclav Hlavac, and Roger Boyle 1993
Colour and Meaning : Art, Science and Symbolism, John Gage 1999
The Oxford Handbook of Computer Music, Roger T. Dean 2009
The Abuse of Beauty : Aesthetics and the Concept of Art, Arthur C. Danto 2003
The Score: The Ian Potter Museum of Art, Jacqueline Doughty 2017
Roy de Maistre : The Australian Years, 1894-1930, Heather Johnson 1988
Colour Music, Niels Hutchinson 1997
Rhythmic Composition in Yellow Green Minor by Roy de Maistre (video), David Muir 1919
Technical Appendix
Microsoft Computer Vision API
Google Maps Javascript API
Image Colour Summariser
Analysis and Synthetic Representation Experiment
Adobe Photoshop CC 2018
Adobe Illustrator CC 2018
Media
Arch Daily
The Spaces
ABC News
ArchitectureAu
Australian Design Review
Design Boom
Ignant
Australian Design Centre