Behind the Code
Q&A with Kaho Cheung, DX Lab Developer and Carlos Arroyo, Painting By Numbers Developer
This post is describing the technology that has been used to build Painting by Numbers.
KC: Can you describe the technology stack for Painting by Numbers.
CA: The backend is built in Python using Flask which is a good micro-framework that doesn’t get in the way when creating scalable WebApps. It has 2 functions:
- It processes the data and images and sends the data to the database – I chose MongoDB for the database because it is a good fit for prototyping and experimenting with processed data.
- It provides a simple RESTful API to allow the frontend and the visualisations to get the data they need to function.
The frontend is built in Angular 4 with TypeScript. I chose this because TypeScript is a cleaner language that should make it easier for another developer to pick up the project and continue developing. The frontend is built around the Angular-seed bootstrap project and not Angular CLI only because Angular CLI was not ready when the project started. This is also the reason the project uses SystemJS rather than Webpack.
KC: How did you create the home page colour tiled visualisation?
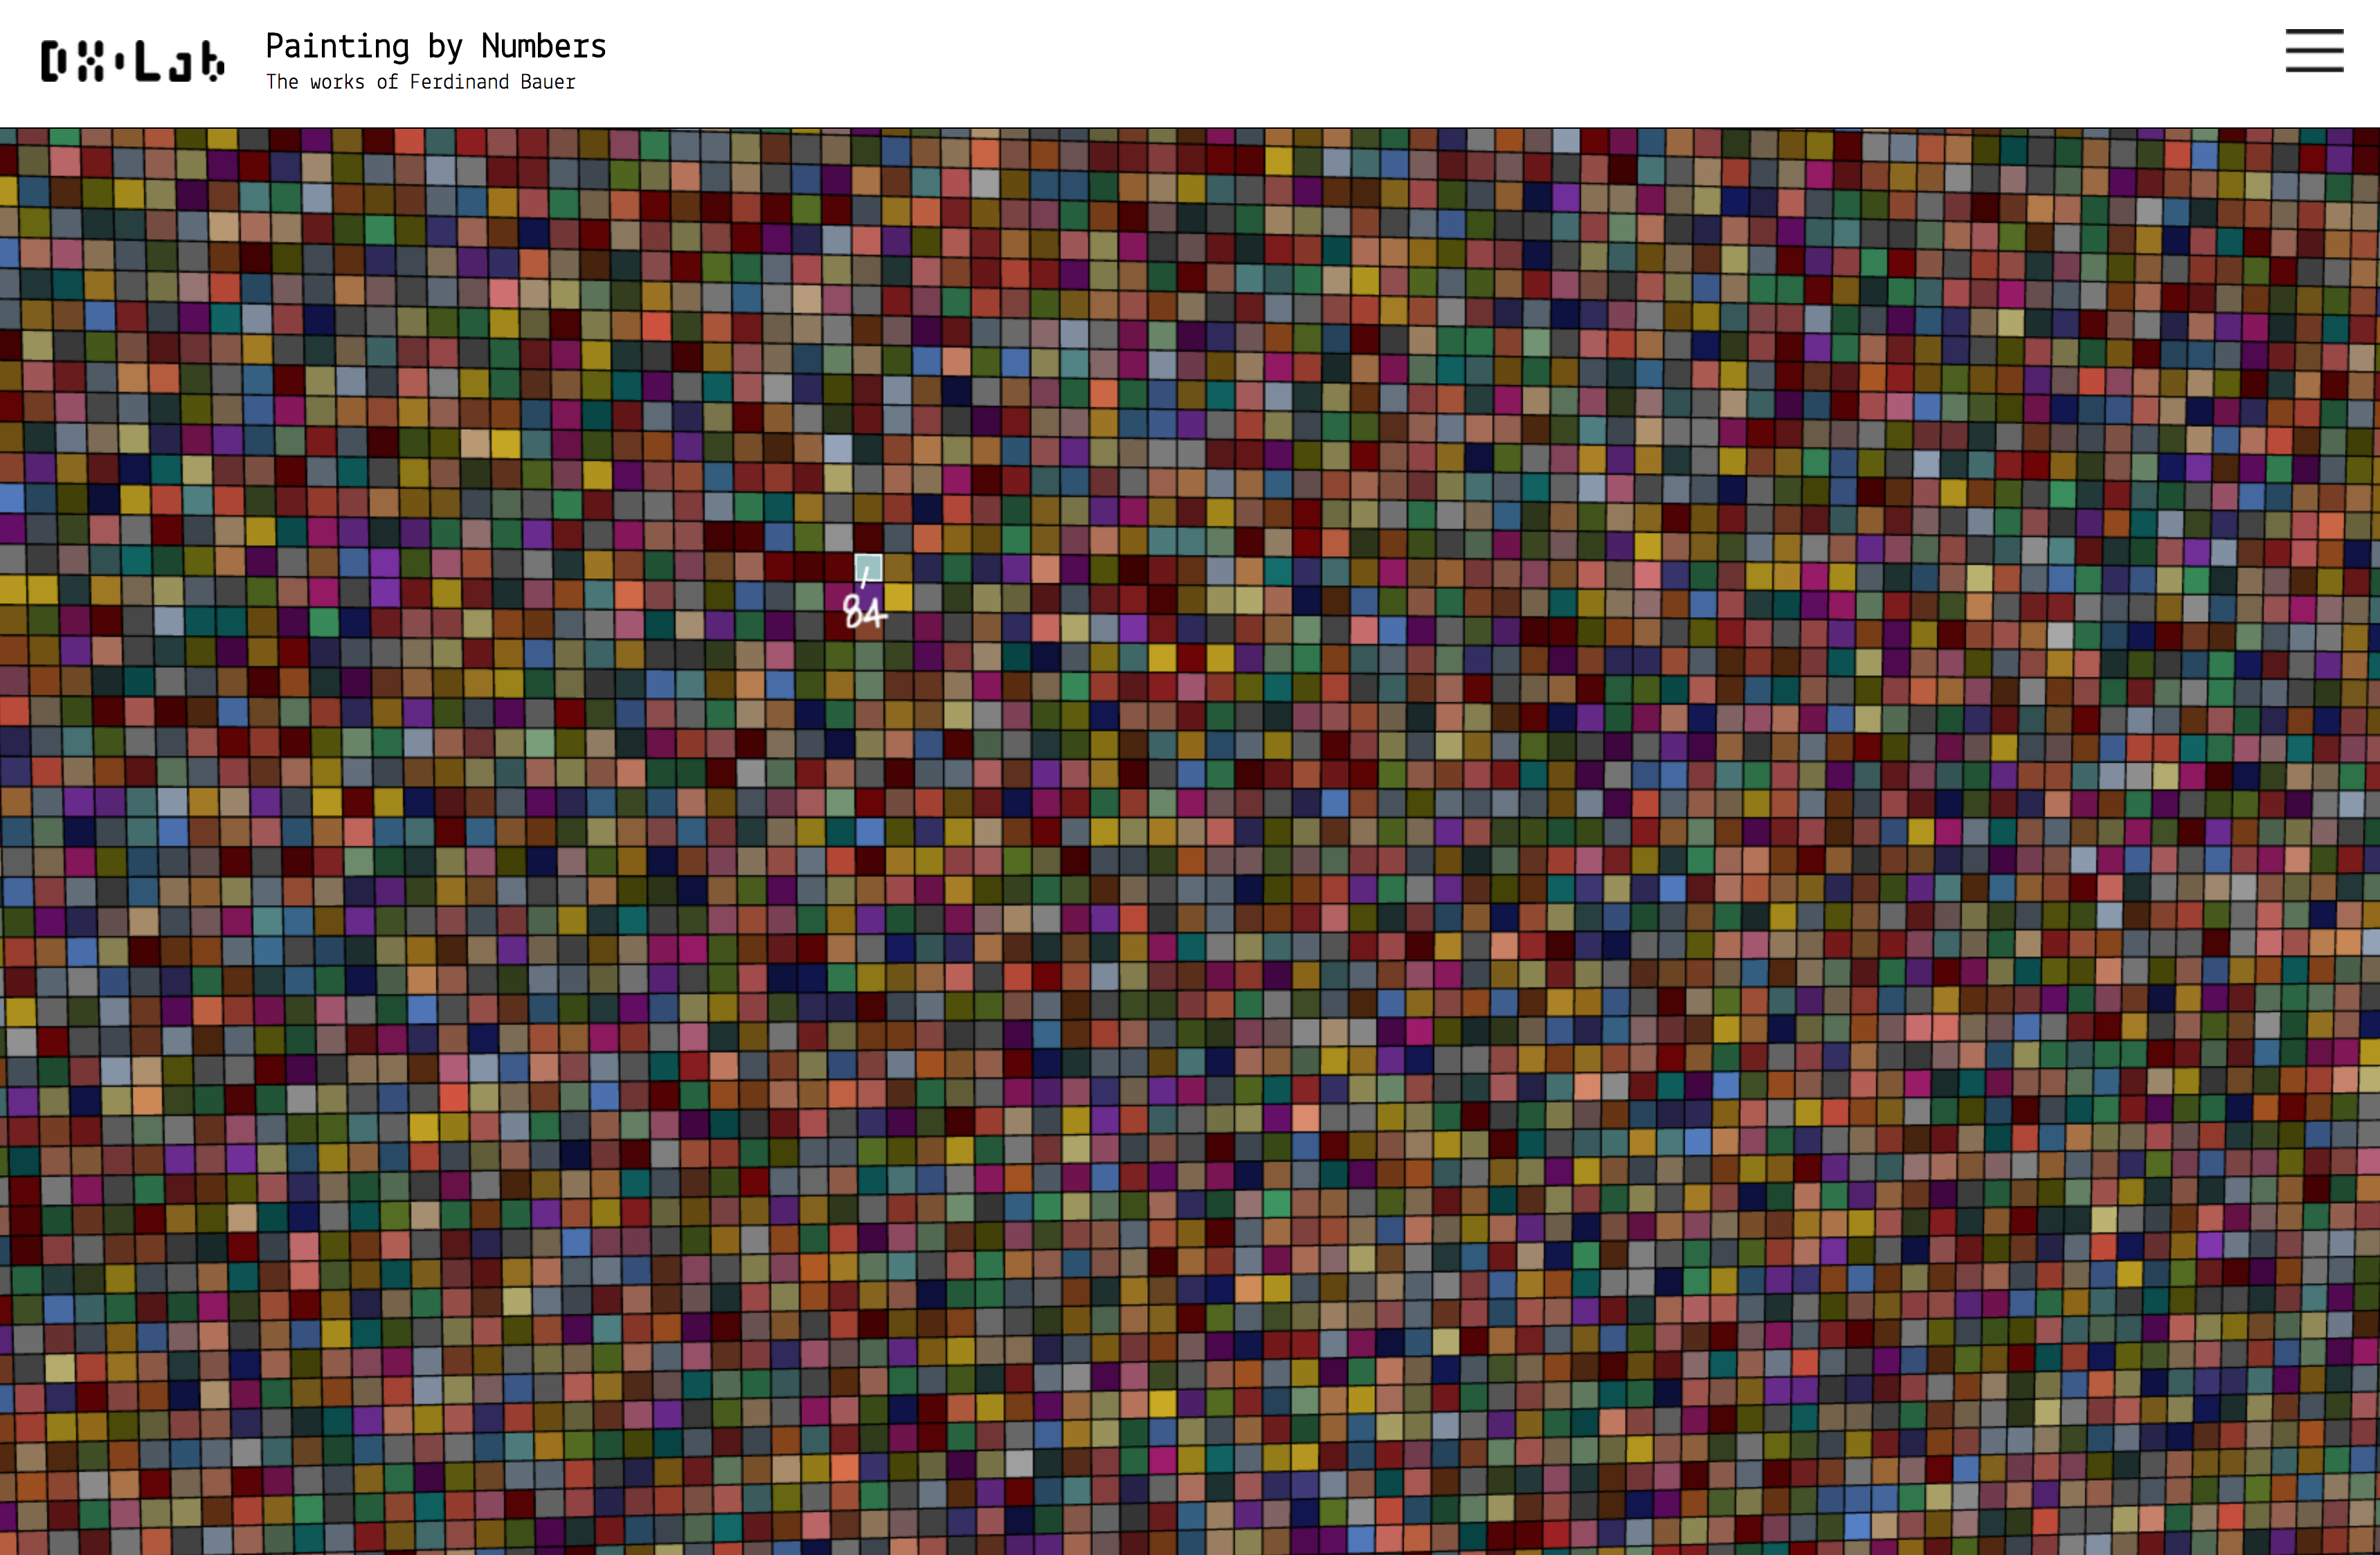
CA: The visualisation is built in WebGL via the ThreeJS library and it uses the colours extracted from Bauer’s drawings and watercolours. The geometry of the plane is a custom ThreeJS BufferGeometry object that allows many small squares to be efficiently processed by the GPU. The transition of colours on the grid is based on a Perlin Noise generator. The grid behaves like a conveyer belt on the top and the sides, a process made possible by manipulating the pixels off the grid.
KC: Could you describe how you extracted the colours from Bauer’s drawings and watercolours.
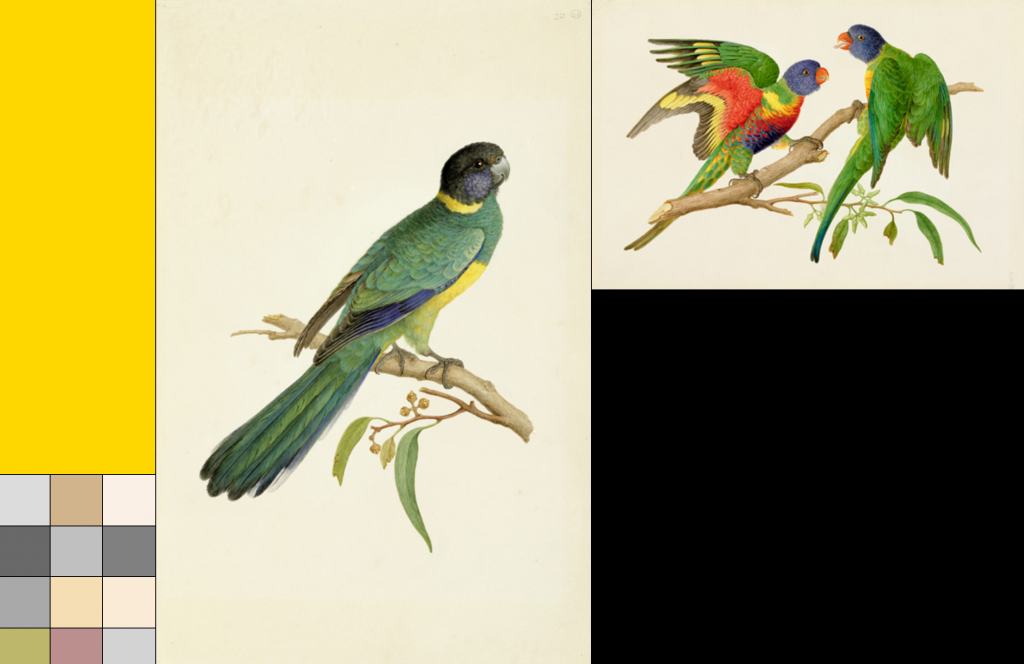
CA: The process starts by reading the image, it then extracts the dominant colours using k-means clustering algorithm. I chose this because it reduces the number of unique colours in the image from 96,615 to 64 while preserving the overall appearance quality. Once the dominant colours are obtained, the nearest CSS colour is found by converting the colour into the Lab Colour Space and then applying the Delta E (CMC) method to calculate colour difference as developed by the Colour Measurement Committee. I chose this algorithm because the resulting colours are the closest to human colour perception. Since the majority of the images are drawings, the most common colours were white and black, hence I had to remove the most white and black colours to generate a more uniform palette. The above process resulted in 80 colours that are the final colours used in the website and in all the visualisations.
KC: Were there any challenges in building the before/after image sliders?
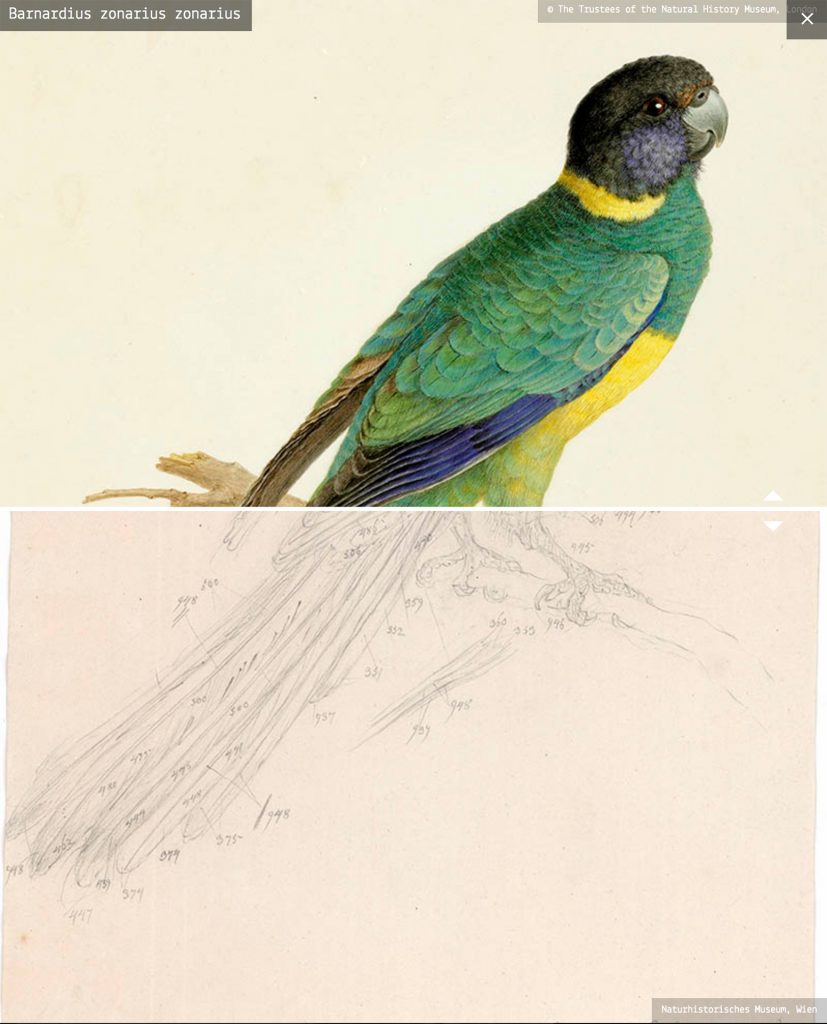
CA: Yes as in every project. The available libraries for building ‘before and after’ images don’t play nicely with Angular 4 and TypeScript, so I had to implement a custom component to do this. However, by doing so I had other challenges as the component needed to be responsive and cross browser compatible.
KC: What was the hardest part of the project?
CA: I won’t call it the hardest but definitely the more challenging was to find the best model to extract the colours without losing details, given that the images are mainly drawings.