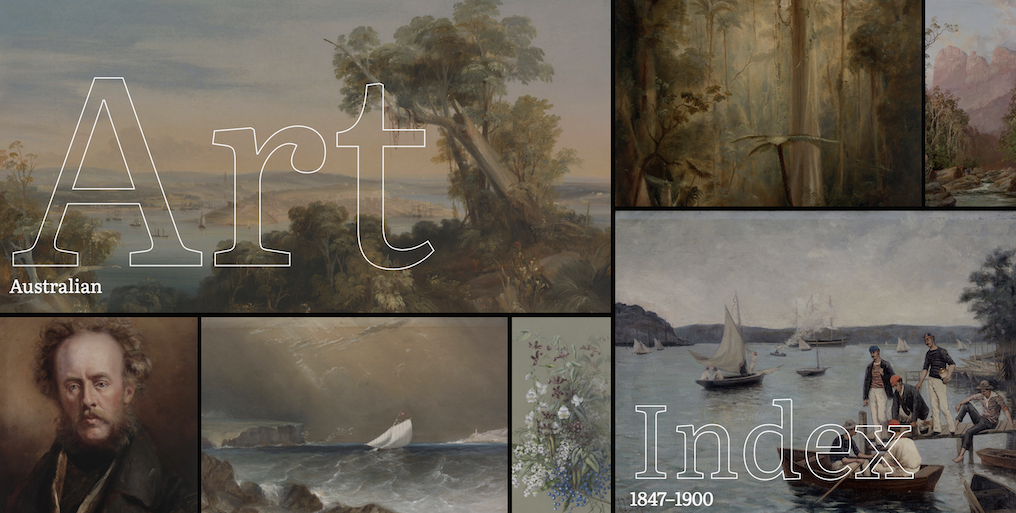
Australian Art Catalogue Index
We are excited to announce the latest project for the DX Lab, The Australian Art Catalogue Index 1847-1900. We were given the challenge of turning a CSV file from the collection into a searchable and more user-friendly web experience.
The Art Index lists over 18,000 artworks exhibited in Australia by Australian-based artists between 1847 (the first documented art exhibition supported by a catalogue in Australia) and 1900. This information is compiled from published art catalogues in the Library’s collections. There are over 2000 artists represented in the data set. The entries detail artwork titles, formats, exhibitions, artists, price and more.
The index was compiled by State Library of New South Wales volunteers between 1989 and 2019 and is downloadable in the Library’s catalogue. It was initiated by Library volunteer, Berry Symons, in 1989. When Berry began this project, entries were recorded on catalogue cards. Berry persisted with the index until her death in 2005. Other Library volunteers since then have contributed to continuing her work and transferred her cards to this online database. This index is dedicated to Berry, and to the hard work of the many volunteers whom have ensured that the index was completed.
Our aims for the website were:
- create a web experience to promote the rich csv data set in the catalogue that is not very accessible in its current form
- promote the work done by Berry Symons and the volunteers that put in a significant effort in creating this data
- provide a useful resource for researchers, artists, auction houses and people interested in art of the time
- include external data sources to enrich the experience for users, such as the inclusion of Wikidata and external sources that link to sites such as cultural heritage collections, Trove, The Library of Congress, Europeana, Australian Dictionary of Biography Online and more
- use data visualisation methods to highlight certain aspects of the information
- open source the code in Github
- explore using the code from the hierarchy browser recently built for the new Library online catalogue.
All of this can be experienced through data visualisations, a search interface and via the explorer.
Technical information, by Luke Dearnley, Web Developer
Having nothing more than a CSV file as a starting point for a project was somewhat daunting. We had very little idea of what we could make from it, so the first thing we did was use the well-known javascript library D3 via the React-friendly d3-render module. We made some charts and graphs to get a handle on the basic ‘shape’ of the dataset contained in the CSV. Refined versions of some of these graphs exist in the final product.
We made a graph showing the number of works each artist had exhibited across the entire index. There are over 2300 artists so we had to cap the graph at 150. One version of the graph was sorted by number of works, so in that case showed the 150 most prolific artists. Another version was sorted by surname giving a sense of the variability in work count across the artists.
Other early graphs showed the number of works exhibited per year and number of works per format. These both persist in the current version of the site, but the formats switched to a bubble chart.
Kaho Cheung, Technical Lead, spent some time experimenting in Observable to get some quick visualisations going.
In order to further breakdown the data we copied it into a Google Sheet where we could manipulate it and use that as our one ‘source of truth’. Tabs were made for works, artists, exhibitions etc which were dynamically fed by formulae drawing on the data in the ‘raw data’ tab. CSV exports of these tabs were used to feed the website via D3.
A combination of formulae and regex (Regular Expression) manipulation were used in several cases to do things like extract price information (as a decimal number) from the Notes field. Here it was mixed in with other text and expressed in pounds, shillings and pence. EG:
For Sale4 £8.8.0. Work said to be by Mme. F Roth.
We wanted to be able to do things such as work out the average price of works per year and then graph them, meaning we needed them as decimal values – in this case 8.4 pounds sterling.
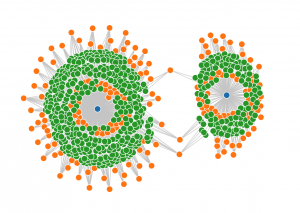
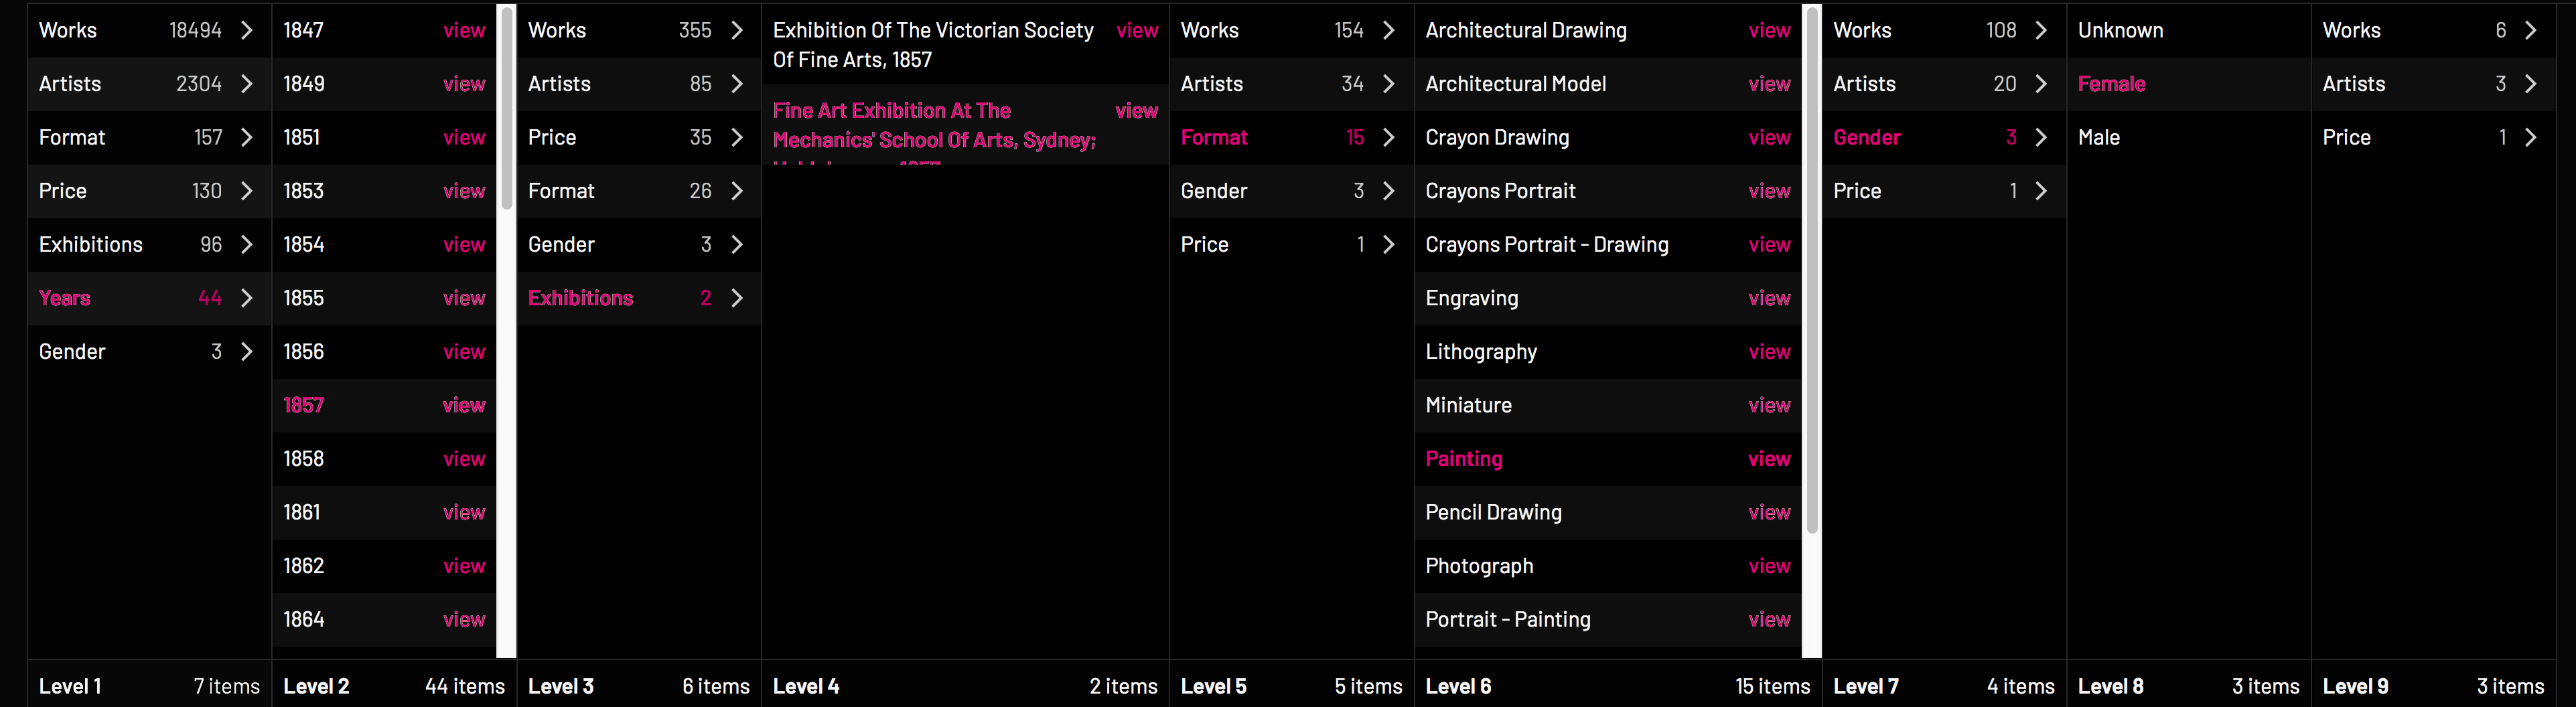
Discussions with Senior Curator Geoff Barker about the data made us realised it could be looked at in different ways, eg: exhibitions in a year, or artists in an exhibition, or works in a format, or formats in an exhibition. Combining that info with learnings from the graph node experiment from earlier, and that’s when we decided to try re-using the Hierarchy Browser code previously developed by the DX Lab for the Library’s new collection interface project. We hoped it would allow people to explore the data by repeatedly narrowing the data set in any ordering of the various fields.
The data is not inherently hierarchical however, so it was necessary to insert a ‘chooser’ column between each column of actual data, which shows the remaining data types via which the data can be navigated. The result of this can be played with on the Explore page of Art Index. You can discover, for example, than of the two exhibitions in 1857, the one at the Mechanics School only has 6 paintings by a total of 3 female artists and 45 by 14 men.
The search page is powered by Fuse.js which has the advantage of being entirely client-side, no need to set up a database, and has nifty features like fuzzy matching, so if you are looking for works by Conrad Martens for example, but misspell the surname as ‘Martin’, you still find his works. Searches can be further refined using numerous facets including format, exhibition, artist and gender.
The conversations with Geoff also revealed that he had been quite prolific in adding linked data around these artists and works into wikidata. We felt not making use of this rich interlinked resource would be a mistake. Doing so however was not exactly straightforward. Items in wikidata are uniquely identified by a Q followed by a number. Geoff supplied us with a list around 20 artists he had been working on and their Q identifiers. We also used a search endpoint to find the Q IDs for as many artists as we could in the top 40 (sorted by number of works).
Once furnished with the Q ID, a REST query to wikidata returns everything they know about it. This is largely a list of what they call ‘properties’, eg P569 for ‘date of birth’, P106 for ‘occupations’. Rather annoyingly however, in many cases the actual value for the property is not included, only another Q ID. So for each one we were interested in, another query was required.
This rather old fashioned quirk aside, we were able to pull in quite an amazing amount of data about artists for whom we could find a Q ID.
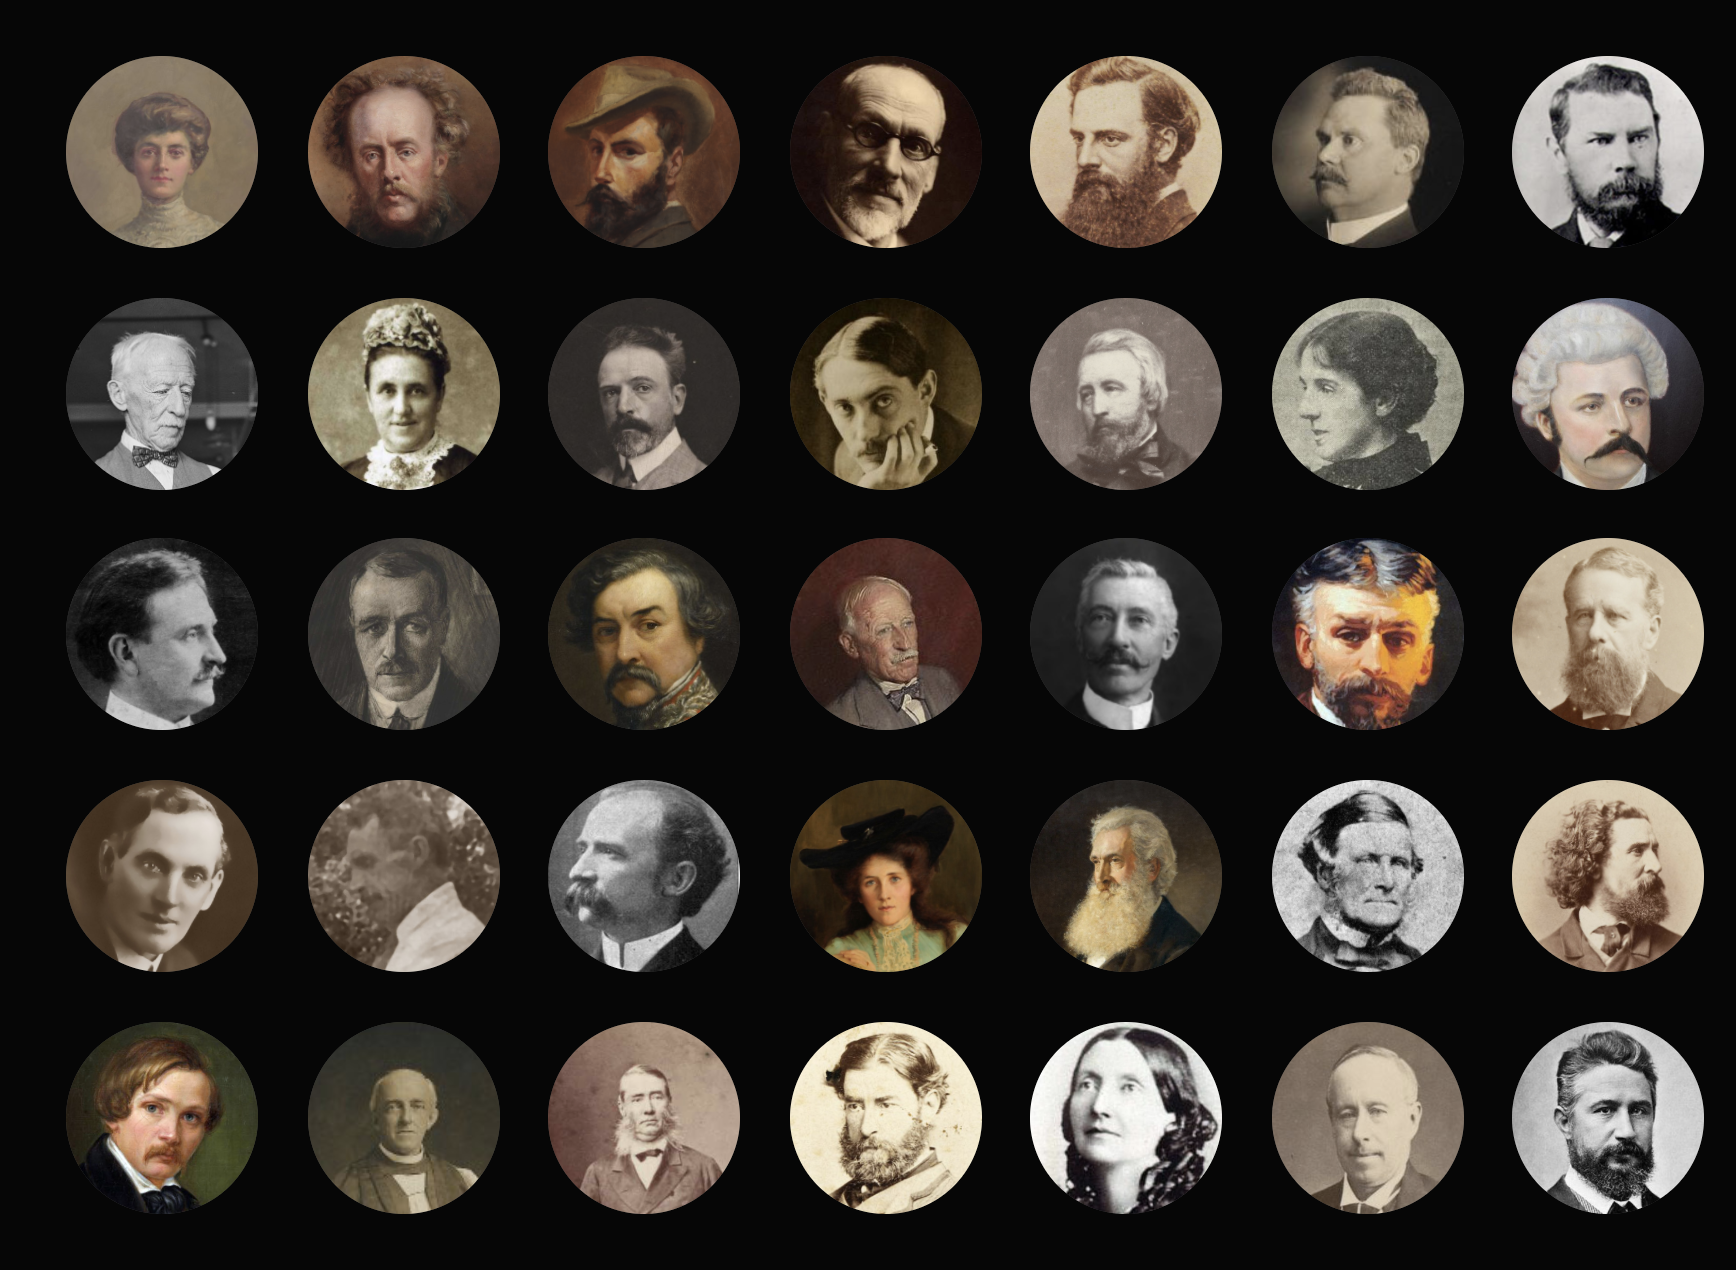
For example the page for Ellis Rowan has some biographical information about her pulled in from wikipedia at the top of the page and below under the ‘external data’ heading we have some description data, a list of places (with links) where her works are held, links to entries on her at the Library of Congress, Trove, the DAAO, Euroreana and more. Last we were able to use the Wikimedia Commons to pull in a grid of images associated with the artist, which are mostly examples of their work, but often also include portraits or photographs of the artist themselves.
At this stage we felt the artist page was looking pretty good, especially given that all we started with was a CSV file.
For the home page, after introducing the Index, we wanted to demonstrate how someone might use the site to research the dataset, and decided to examine things through the lens of gender to do so.
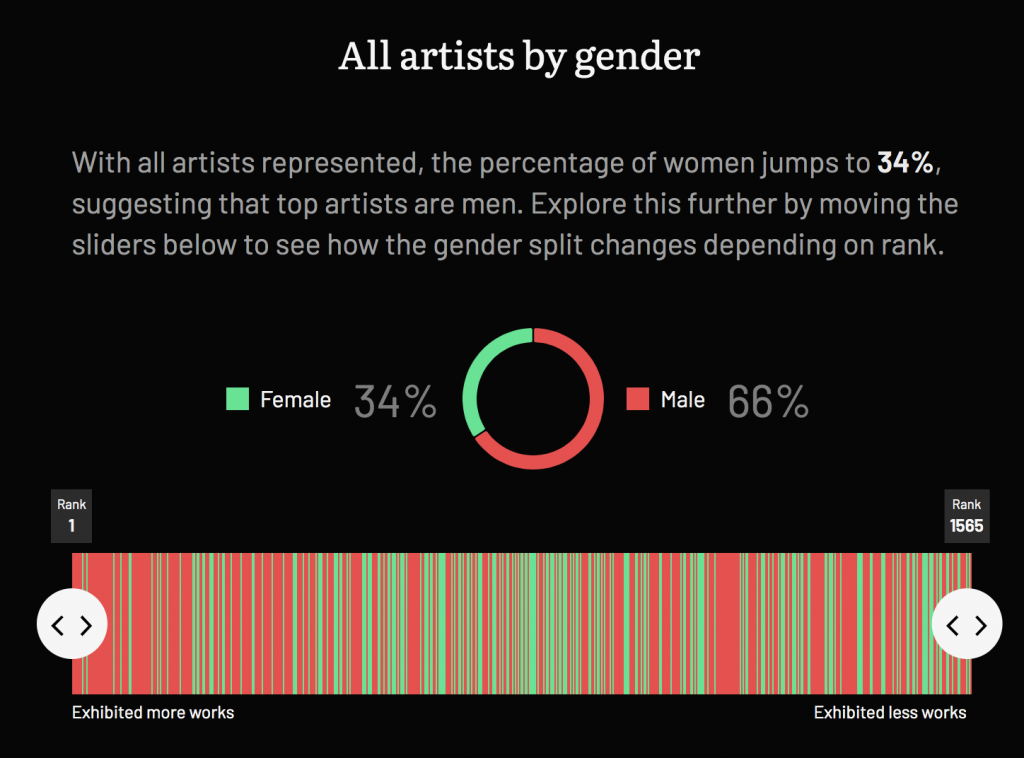
Information gleaned from the Index’s dataset were things like how prevalent female artists were in the top 10 and top 50 artists (ranked by number of works), which work formats were more popular with women versus men and how the average price of works varies by gender over time and more.
Geoff Barker, Senior Curator, Research & Discovery, describes below the work required to get the item into the catalogue and Wikidata.
Australian Art Exhibition Catalogue Index, 1847-1900 (AAECI) was created by volunteers in a number of different versions of Microsoft Access over a nearly ten year period. By 2019, when the final entries were completed the data was still locked in an out-dated version of Access and needed to be migrated to another platform. We decided to export all of the data to a flat .csv file and once backed up we eliminated some of the duplicate information.
We then imported the file into Open Refine. This was an essential step because given the number of different volunteers and the length of time taken to complete the project there were inevitably many inconsistencies in the way the data had been entered. Using Open Refine I spent more hours than I care to remember making sure titles, catalogues, references, and names across the 18,000 records were reasonably consistent.
Once the data was prepared the next step was to arrange for the Library to create a new catalogue entry in the Library database. The data set was renamed the Australian Art Exhibition Catalogue Index, 1847-1900 (AAECI) and treating it as a ‘born digital’ acquisition allowed it to be ingested into our database. It now has its own catalogue record which acts as a master file for the data and is easy to download and repurpose for other projects by Library users. Library Staff Suzette Burnati, Suzanne Brassil, and Matthew Burgess all helped with this process.
Once the master file had been ingested into the catalogue, I started developing some data-subsets. The first was an index of the artists whose works were represented in the catalogues which could be linked to external projects, in this case Wikipedia and Wikidata. I started by assigning new fields gender and the field of art which they were best known for. This resulted in a list of 2247 individual artists of which 482 were female, 996 were male and 769 were unable to be identified by the titles that are used before surnames. These were then assigned Wikidata properties to try to link the list of artists to entries in Wikidata. This would in turn allow for the extraction of biographical, location, and collection based information contributed by Wikimedia users from around the world.
Linking to Wikidata’s linked open access database offers many opportunities to experiment with rebuilding new sets of information by linking the AAECI data with that held in other institutions nationally and internationally. Working with Toby Hudson, a Wikipedian who kindly helped the Library out with his coding skills, 2232 of the artists were imported into an online tool called Mix’n’Match. Using this tool Toby and I were able to match 369 artists to existing Wikidata articles, many of which had a corresponding Wikipedia article. This Mix’n’Match can still be worked on while a draft view of content relating to Conrad Martens is also online.
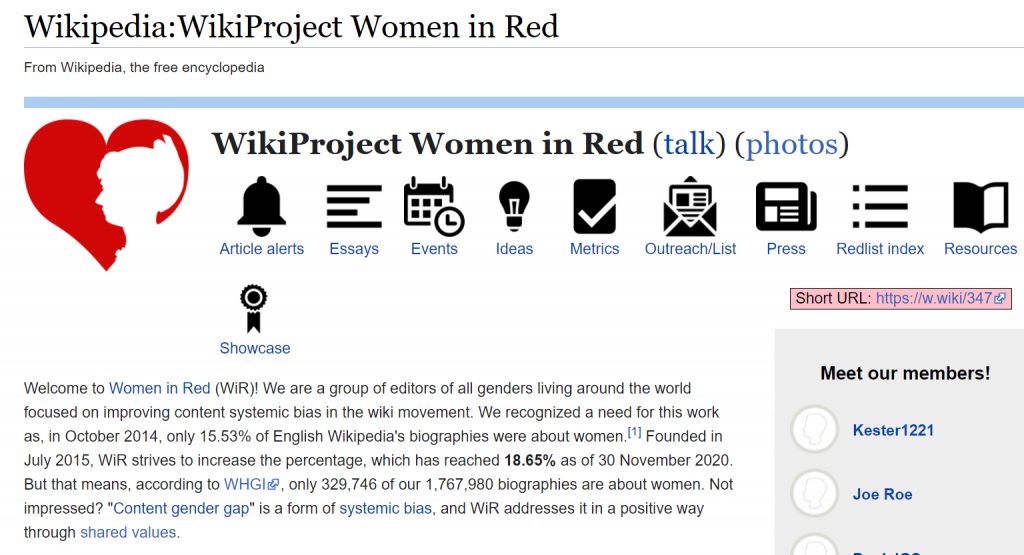
The collating of this data coincided with Wikimedia’s 2019 Women in Red project which focussed on creating content regarding women’s biographies, women’s works, and women’s issues. The objective was to turn “redlinks” with no articles into blue ones which linked to articles. Entries relating to women artists extracted from the AAECI were provided to the Australian edit-a thon for the ‘Woman in Red’ project.
The next step along the way for the AAECI is DX Lab’s work which pulls together many of these different threads to create a user-friendly interface for the data. I have no doubt that making this rich data-set open and easily shared will lead to many more wonderful projects for anyone with an interest in the History of Art in Australia.
Check out the Art Index here and let us know if you find any new discoveries.
Comments
What a brilliant project and very beautifully presented! Congratulations all!